Inflation is defined as an increase in money supply. Price inflation results after the money supply has been increased. The U.S. Government wants us to focus on price inflation rather than true inflation of the money supply. Remember when the Fed quit publishing M3 Money Supply increases? They said it cost too much money to publish. Give me a break! They print the stuff. This was as of March 23rd, 2006. They knew they had problems then.
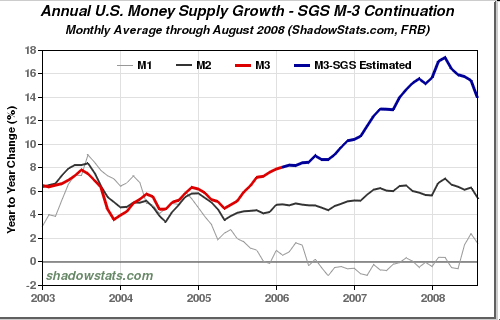
The graph below depicts the growth of the U.S. Money Supply- M3. M3 is the broadest and most complete measure of the overall money supply of the United States. It is the best overall indicator of inflation and expected price inflation.
We are about 1/3 of the way through the crisis. Hank Paulson needs some more money to fix the problem. Let’s see what will push the value of the U.S. Dollar down and the relative value of gold up:
1. Fed’s discount window: $33bn balance
2. Expansion of temporary swap lines with central banks: $180bn
3. Fed loans through the Primary Dealer Credit Facility: $20bn through sep 17
4. Treasury purchase of GSE MBS (Mortgage-Backed Securities) this month: $10bn
5. Potential cost of Fannie/Freddie bailout: $200-$300bn
6. Loan to AIG: $85bn
7. Treasury buying mortgage-related assets: $700bn – $1,500bn
8. Potential supplementary stimulus package favored by Democrats: $100bn
9. Insuring money market funds: $50bn
10. Treasury fortifying the Fed’s balance sheet: $100bn
11. Treasury fortifying the FDIC’s balance sheet: $150bn+ (799 financial institutions are suspect now)
12. Fed purchase of agency discount notes & ABCP(Asset-Backed Commercial Paper): amount not specified
Total $1.7 Trillion to $2.5 Trillion
"A trillion here, a trillion there… before long, you’re talkin’ real money!